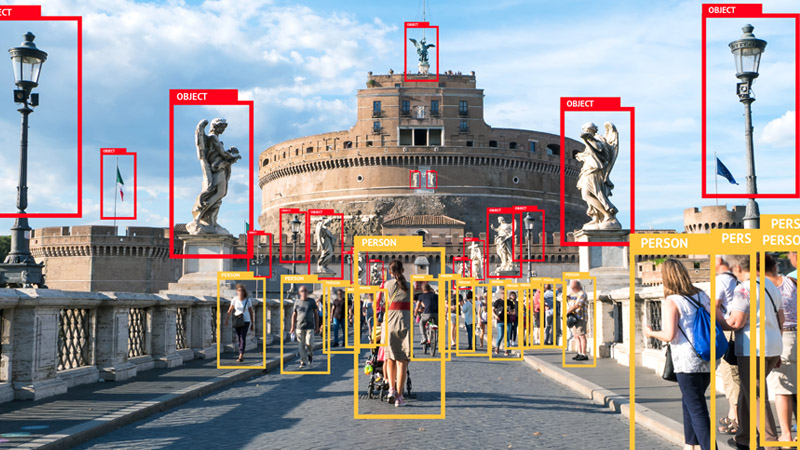
Creating Computer vision datasets
How to create a new novel datasets from a few set of images.

import pandas as pd
from matplotlib import pyplot as plt
import seaborn as sns
import ast
import plotly.express as px
import geopandas as gpd
le = pd.read_csv("../input/buildings-amenities-all-over-india/leisure.csv")
le.head()
| Unnamed: 0 | name | leisure | longitude-lattitude | All_tags | |
|---|---|---|---|---|---|
| 0 | 249132377 | DLF Golf Links Golf Course | golf_course | (77.10471029999984, 28.45473270000001) | {'name': 'DLF Golf Links Golf Course', 'barrie... |
| 1 | 250737365 | NaN | park | (80.23786640000002, 13.04278489999996) | {'leisure': 'park'} |
| 2 | 250979543 | Yoga Centre | sports_centre | (75.8870475, 31.52995199999996) | {'name': 'Yoga Centre', 'leisure': 'sports_cen... |
| 3 | 280167017 | Black Thunder | water_park | (76.9132247999999, 11.32635400000001) | {'name': 'Black Thunder', 'leisure': 'water_pa... |
| 4 | 280701513 | Ootacamund Gymkhana Golf Course | golf_course | (76.67157809999996, 11.417312599999995) | {'name': 'Ootacamund Gymkhana Golf Course', 'l... |
# remove all tags column and rename columns
le = le.drop("All_tags", axis=1)
le.columns = ["id", "name", "leisure", "lo-la"]
le.head()
| id | name | leisure | lo-la | |
|---|---|---|---|---|
| 0 | 249132377 | DLF Golf Links Golf Course | golf_course | (77.10471029999984, 28.45473270000001) |
| 1 | 250737365 | NaN | park | (80.23786640000002, 13.04278489999996) |
| 2 | 250979543 | Yoga Centre | sports_centre | (75.8870475, 31.52995199999996) |
| 3 | 280167017 | Black Thunder | water_park | (76.9132247999999, 11.32635400000001) |
| 4 | 280701513 | Ootacamund Gymkhana Golf Course | golf_course | (76.67157809999996, 11.417312599999995) |
# set the ID as index
le.index = le["id"]
le = le.drop("id", axis = 1)
le.head()
| name | leisure | lo-la | |
|---|---|---|---|
| id | |||
| 249132377 | DLF Golf Links Golf Course | golf_course | (77.10471029999984, 28.45473270000001) |
| 250737365 | NaN | park | (80.23786640000002, 13.04278489999996) |
| 250979543 | Yoga Centre | sports_centre | (75.8870475, 31.52995199999996) |
| 280167017 | Black Thunder | water_park | (76.9132247999999, 11.32635400000001) |
| 280701513 | Ootacamund Gymkhana Golf Course | golf_course | (76.67157809999996, 11.417312599999995) |
# check NA values
le.isna().sum()
name       27143
leisure        0
lo-la      37876
dtype: int64
the latitude and longitude are the most important columns so we will drop all rows that do not have them
le = le[le['lo-la'].notna()]
le
| name | leisure | lo-la | |
|---|---|---|---|
| id | |||
| 249132377 | DLF Golf Links Golf Course | golf_course | (77.10471029999984, 28.45473270000001) |
| 250737365 | NaN | park | (80.23786640000002, 13.04278489999996) |
| 250979543 | Yoga Centre | sports_centre | (75.8870475, 31.52995199999996) |
| 280167017 | Black Thunder | water_park | (76.9132247999999, 11.32635400000001) |
| 280701513 | Ootacamund Gymkhana Golf Course | golf_course | (76.67157809999996, 11.417312599999995) |
| ... | ... | ... | ... |
| 8277782288 | NaN | playground | (76.29733219999959, 10.029497999999887) |
| 8280851413 | Gothuruth muzhiris park | park | (76.21773650000003, 10.190251200000016) |
| 8280851414 | Gothuruth Muzhiris park | park | (76.21771200000003, 10.190284000000016) |
| 8281209559 | Exalt Fitness Club Gym | fitness_centre | (72.56438300000039, 23.089663400000084) |
| 8281506191 | NaN | playground | (75.54409639999994, 11.927387099999967) |
5813 rows × 3 columns
fill the missing names with the word “missing”
le['name'].fillna("missing", inplace=True)
le
| name | leisure | lo-la | |
|---|---|---|---|
| id | |||
| 249132377 | DLF Golf Links Golf Course | golf_course | (77.10471029999984, 28.45473270000001) |
| 250737365 | missing | park | (80.23786640000002, 13.04278489999996) |
| 250979543 | Yoga Centre | sports_centre | (75.8870475, 31.52995199999996) |
| 280167017 | Black Thunder | water_park | (76.9132247999999, 11.32635400000001) |
| 280701513 | Ootacamund Gymkhana Golf Course | golf_course | (76.67157809999996, 11.417312599999995) |
| ... | ... | ... | ... |
| 8277782288 | missing | playground | (76.29733219999959, 10.029497999999887) |
| 8280851413 | Gothuruth muzhiris park | park | (76.21773650000003, 10.190251200000016) |
| 8280851414 | Gothuruth Muzhiris park | park | (76.21771200000003, 10.190284000000016) |
| 8281209559 | Exalt Fitness Club Gym | fitness_centre | (72.56438300000039, 23.089663400000084) |
| 8281506191 | missing | playground | (75.54409639999994, 11.927387099999967) |
5813 rows × 3 columns
most available types of leisure places according to type
le["leisure"].value_counts()
park                        1798
playground                   773
fitness_centre               580
resort                       544
pitch                        497
sports_centre                495
fishing                      238
garden                       196
stadium                      159
swimming_pool                155
dance                         58
fitness_station               56
nature_reserve                52
water_park                    24
marina                        20
slipway                       16
beach_resort                  14
common                        13
amusement_arcade              12
track                         10
yes                           10
outdoor_seating                9
golf_course                    8
recreation_ground              6
club                           6
bandstand                      5
bowling_alley                  5
hackerspace                    5
bird_hide                      4
adult_gaming_centre            4
sauna                          4
picnic_table                   3
swimming_area                  3
firepit                        3
horse_riding                   3
cultural_centre                2
gym                            2
hot_spring                     2
indoor_play                    2
wildlife_hide                  2
spa                            2
Park in residential area       1
aquarium                       1
leisure                        1
ground                         1
Meeting_point                  1
sports_hall                    1
summer_camp                    1
social_club                    1
yoga                           1
schoolyard                     1
NITTE FOOTBALL STADIUM         1
quary                          1
yoga_centre                    1
Name: leisure, dtype: int64
lets draw a graph for an easier understanding
plt.rcParams['font.size'] = 10.0
plt.rcParams['figure.figsize'] = 20, 10
ax = sns.countplot(le['leisure'], palette="Blues_r", order=le.leisure.value_counts()[:20].index)

ax.set_title("Most Avaiable Leisure Places in India")
# rotate the names so they fit
ax.set_xticklabels(ax.get_xticklabels(), rotation=40, ha="right")
plt.tight_layout()
plt.show()
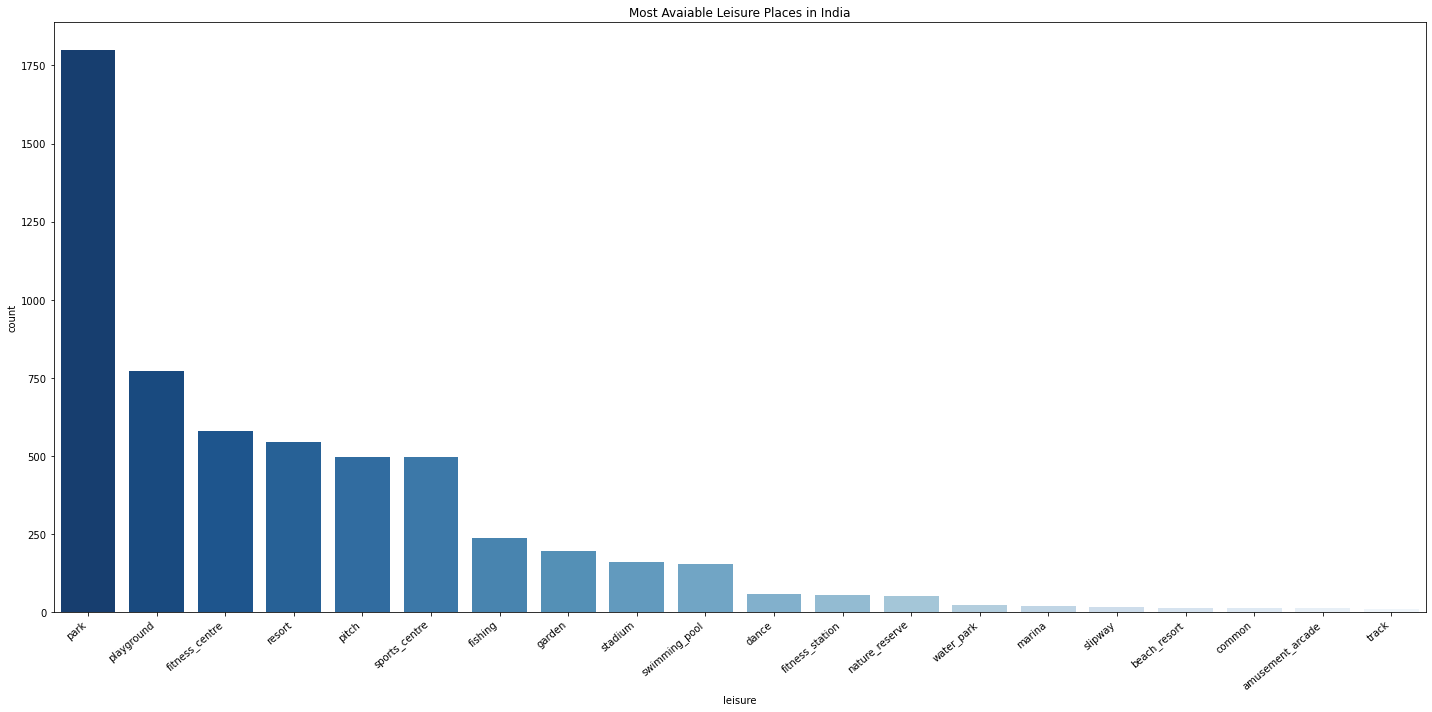
parks are the most common type of leisure building in india
# split coordinates
cords = list(le["lo-la"])
long = []
lat = []
for cord in cords:
    set_r = ast.literal_eval(cord)
    long.append(set_r[0])
    lat.append(set_r[1])

le["long"] = long
le["lat"] = lat
le.head()
| name | leisure | lo-la | long | lat | |
|---|---|---|---|---|---|
| id | |||||
| 249132377 | DLF Golf Links Golf Course | golf_course | (77.10471029999984, 28.45473270000001) | 77.104710 | 28.454733 |
| 250737365 | missing | park | (80.23786640000002, 13.04278489999996) | 80.237866 | 13.042785 |
| 250979543 | Yoga Centre | sports_centre | (75.8870475, 31.52995199999996) | 75.887047 | 31.529952 |
| 280167017 | Black Thunder | water_park | (76.9132247999999, 11.32635400000001) | 76.913225 | 11.326354 |
| 280701513 | Ootacamund Gymkhana Golf Course | golf_course | (76.67157809999996, 11.417312599999995) | 76.671578 | 11.417313 |
# drop the old coordinates column
le = le.drop("lo-la", axis=1)
le.head()
| name | leisure | long | lat | |
|---|---|---|---|---|
| id | ||||
| 249132377 | DLF Golf Links Golf Course | golf_course | 77.104710 | 28.454733 |
| 250737365 | missing | park | 80.237866 | 13.042785 |
| 250979543 | Yoga Centre | sports_centre | 75.887047 | 31.529952 |
| 280167017 | Black Thunder | water_park | 76.913225 | 11.326354 |
| 280701513 | Ootacamund Gymkhana Golf Course | golf_course | 76.671578 | 11.417313 |
# basic scatter plot of places
plt.scatter(x=le["long"], y=le["lat"])
plt.show()
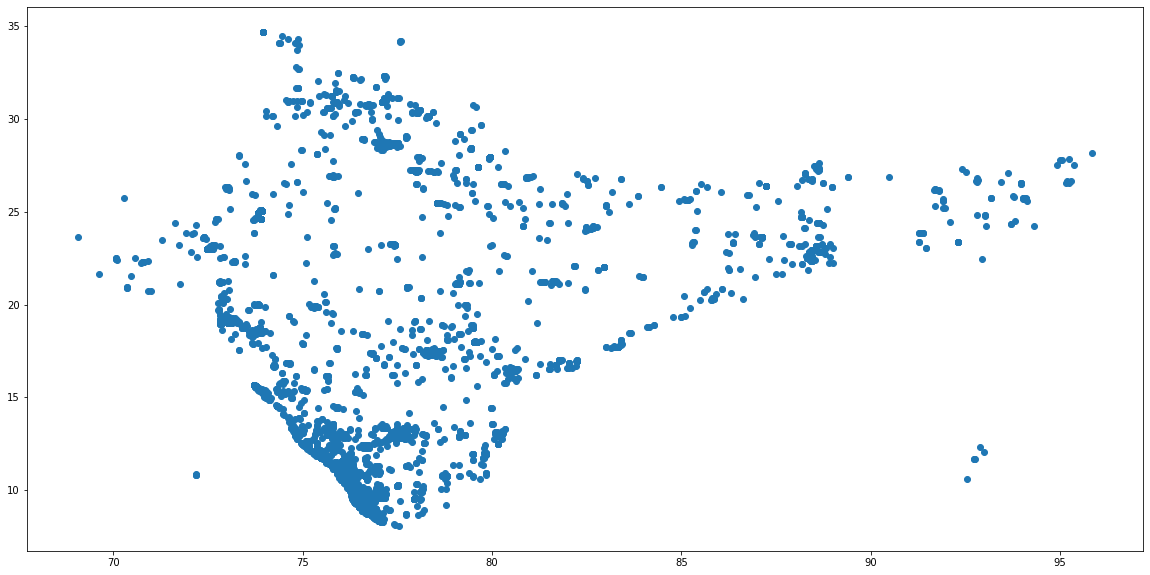
above is the initial shape of the locations in the map based on their longitude and latitude, we can already see that the shape looks like india meaning there are many leisure places around the country
# create and view geopandas dataframe
gdf = gpd.GeoDataFrame(
    le, geometry=gpd.points_from_xy(le.long, le.lat))
gdf
| name | leisure | long | lat | geometry | |
|---|---|---|---|---|---|
| id | |||||
| 249132377 | DLF Golf Links Golf Course | golf_course | 77.104710 | 28.454733 | POINT (77.10471 28.45473) |
| 250737365 | missing | park | 80.237866 | 13.042785 | POINT (80.23787 13.04278) |
| 250979543 | Yoga Centre | sports_centre | 75.887047 | 31.529952 | POINT (75.88705 31.52995) |
| 280167017 | Black Thunder | water_park | 76.913225 | 11.326354 | POINT (76.91322 11.32635) |
| 280701513 | Ootacamund Gymkhana Golf Course | golf_course | 76.671578 | 11.417313 | POINT (76.67158 11.41731) |
| ... | ... | ... | ... | ... | ... |
| 8277782288 | missing | playground | 76.297332 | 10.029498 | POINT (76.29733 10.02950) |
| 8280851413 | Gothuruth muzhiris park | park | 76.217737 | 10.190251 | POINT (76.21774 10.19025) |
| 8280851414 | Gothuruth Muzhiris park | park | 76.217712 | 10.190284 | POINT (76.21771 10.19028) |
| 8281209559 | Exalt Fitness Club Gym | fitness_centre | 72.564383 | 23.089663 | POINT (72.56438 23.08966) |
| 8281506191 | missing | playground | 75.544096 | 11.927387 | POINT (75.54410 11.92739) |
5813 rows × 5 columns
# set mapbox acces token (required for drawing an interactive map)
px.set_mapbox_access_token("pk.eyJ1IjoiYmxhY2tzdWFuMTkiLCJhIjoiY2twcDdtaGc4MDZ6djJvczR0Ym9sa3pqNCJ9.gNL1mxeSmDi6hfgwxz2qRA")
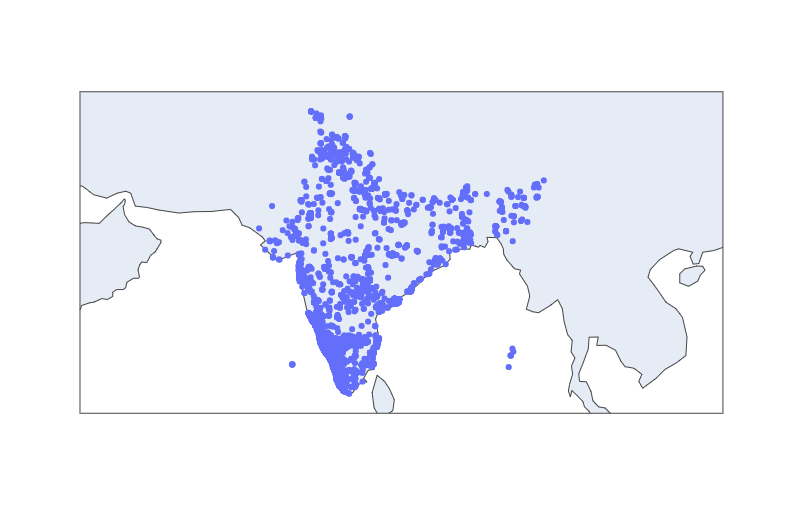
# generate and show points in map (its intractive!)
fig = px.scatter_geo(gdf,
                    lat=gdf.geometry.y,
                    lon=gdf.geometry.x,
                    hover_data=["name", "leisure"],
                    locationmode="country names"
                    )
fig.update_geos(fitbounds="locations") # zoom in to only india
fig.show()
# check the project source code for the interactive version of the map
How to create a new novel datasets from a few set of images.
Data Science Project

Data Science Project

A Decentralized Application that simulates a bank using blockchain